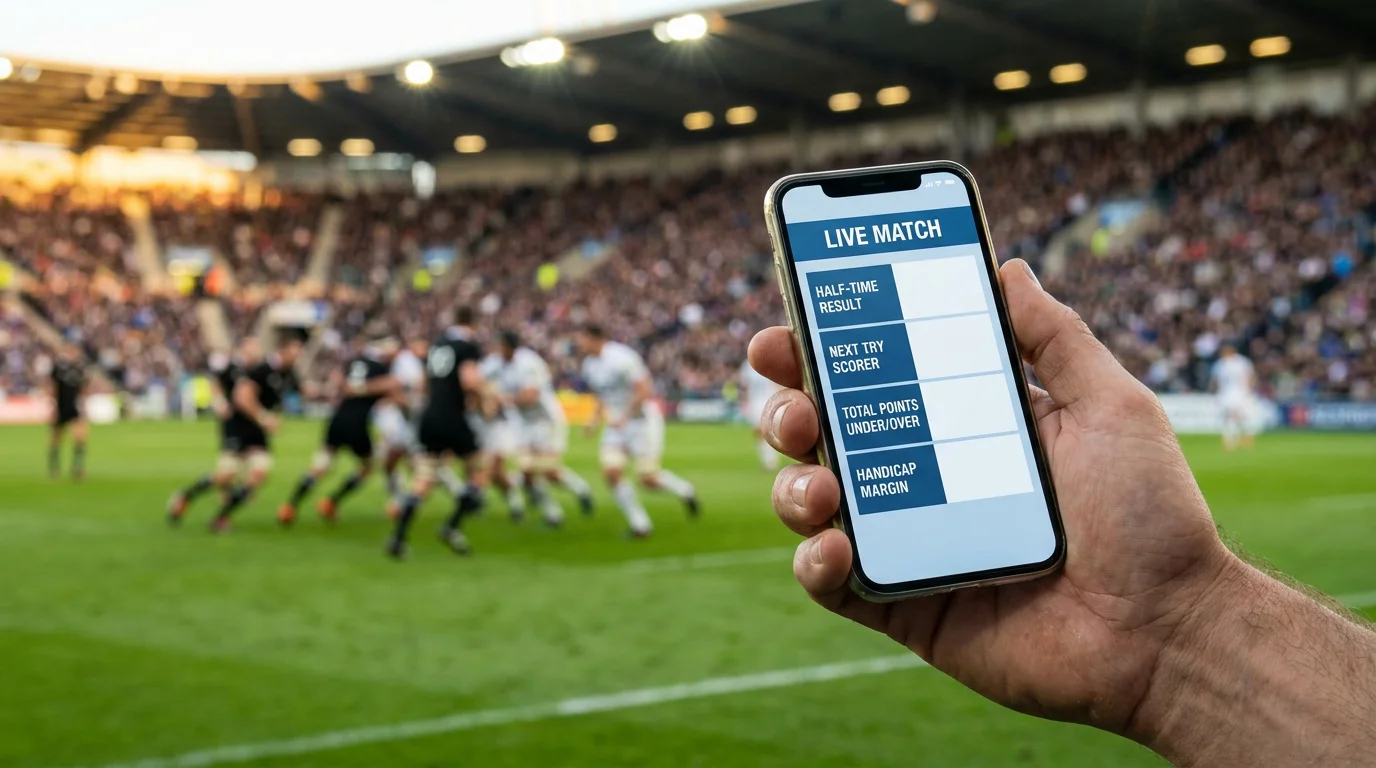
In-Play Rugby Betting Strategy: Live Markets, Latency and Cash-Out
 Available in US
The first time I lost money to stream latency, I was watching a Six Nations match in a hotel room in Geneva on a bookmaker’s in-app stream. England were on the Welsh line. I saw the line break, I tapped to back England try scored, and the price was already 1/8 when my bet went through. By the time the bet settled, the try had been scored eight seconds earlier. I’d paid a “try already scored” price for what I thought was a “try imminent” market. The bookmaker’s pricing was correct. My information was eight seconds late.
That experience reset how I think about in-play rugby betting. Live betting is the largest growth area in rugby — live and in-play formats now account for roughly 45 percent of the global sports betting volume, with mobile betting making up around 70 percent of all activity. Rugby specifically generates around $8.26 billion in global betting market value, with a projected 8.1 percent compound annual growth rate. The volume is large and growing. The execution challenges are equally real.
What makes in-play rugby betting different from pre-match is the time pressure. Pre-match you can spend 30 minutes building a position, comparing prices across books, refining your stake. In-play you have seconds — sometimes less than the latency on your live stream — to make decisions that will be priced by sharper algorithms than yours. The edge has to be larger to compensate, and the execution has to be cleaner.
This guide is the practical playbook I’ve built over 9 years of live rugby betting, mostly profitable but with enough scars to know exactly where the pitfalls are. We’ll cover how in-play pricing actually works, why the 7-10 second stream latency matters more than people think, the live market catalogue, the key game moments where live entry actually pays, the cash-out math, the behavioural biases that destroy live bettors, and where the mobile share of live betting fits into the picture.
How in-play rugby pricing actually works
The price you see on your screen for an in-play rugby market is the output of an algorithm that updates probably every 1-2 seconds, based on a model that ingests the match score, the time remaining, the field position, the team strength priors, and a number of dynamic factors like player on-pitch status. That algorithm runs continuously, even when nothing is happening on the pitch. When something does happen — a try, a penalty, a sin-bin — the model recalculates faster than the human eye can follow.
The market is two-sided in the technical sense: the bookmaker’s algorithm calculates a fair price, adds an overround margin (typically 8-12 percent for in-play markets), and publishes the back price. Some books also publish lay prices on selected markets, but most UK retail books offer only back prices in-play. The overround is wider in-play than pre-match because the bookmaker has to compensate for execution latency, anomalous bet detection time, and the risk that an in-play bettor has information the model doesn’t.
That overround is the first reality of in-play pricing. The fair probability of a market might be 50 percent, but the back price will reflect 54 percent or 55 percent implied probability. To find positive expected value in-play, your edge has to be larger than the overround. That’s a higher bar than pre-match, where the equivalent overround is typically 4-6 percent.
The second reality is that the model running the in-play pricing is sharper than the average bettor’s intuition. Books employ rugby-specific traders and use historical match data to calibrate the model. The probability that a side trailing by 5 with 8 minutes left wins the match is, on the book’s model, a precise number — not the 30 percent or 40 percent that a punter might intuit. To beat the in-play market consistently, you need either better information than the model (rare) or a better behavioural read on the public’s response to specific game events (more achievable).
The pricing also responds asymmetrically to different events. A try is the largest single price-mover — it can shift the match-winner line by 15-25 percentage points in a tight match. A sin-bin shifts the line by 5-10 points. A penalty in front of goal might shift it by 1-3 points. A breakdown turnover shifts it by less than 1 point. Understanding which events the model treats as significant — and which it doesn’t — is the foundation of in-play edge.

Stream latency, the 7 to 10 second tax
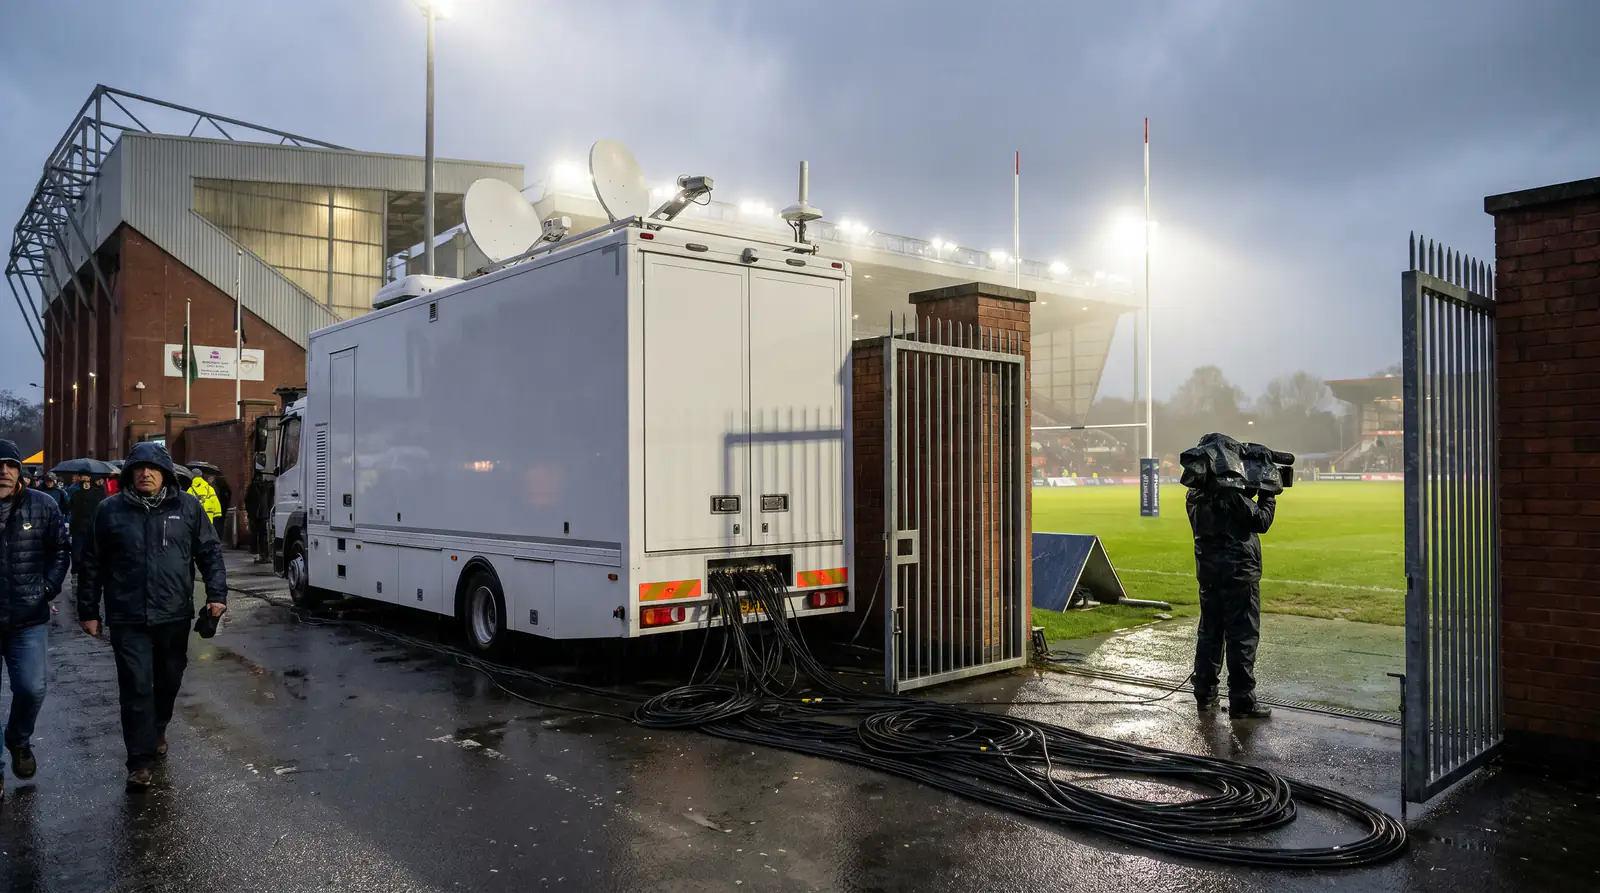
This is the most underdiscussed element of in-play rugby betting, and the one that costs casual bettors the most money. The video stream you’re watching — whether from a TV broadcast, a bookmaker’s in-app stream, or a streaming service — is typically 7 to 10 seconds behind the actual live action. The bookmaker’s pricing model is fed by a data feed that runs significantly closer to real time, often within 1-2 seconds of the actual event.
That 7-10 second gap is your information disadvantage. By the time you see something happen on screen and reach for the bet button, the bookmaker has already updated the price to reflect what actually happened. The price you tap is the post-event price, not the pre-event price. You are, mechanically, betting on the past.
The gap is largest in mobile betting and on app streams. Live and in-play formats account for 45 percent of total sports betting volume, and mobile betting now drives around 70 percent of all activity. The vast majority of in-play rugby bets are placed on mobile devices, watching streams that run on the higher end of the latency range. The combination of mobile execution and streaming latency is what makes in-play rugby betting structurally difficult.
What can a bettor do about it? Three things. First, accept the latency. Don’t try to bet on events you’ve just seen — by the time you see them, they’re priced. Second, bet on events you can anticipate before they happen. A side approaching the try line with sustained possession and forward momentum is on its way to a try — the price moves before the try is scored. The pre-try entry window is where the latency disadvantage flips into a latency advantage. Third, use the data feeds rather than the video feed where you can. Some bookmakers offer text-based match centre views (try, penalty, kick, line break) that run closer to the actual data feed. These are uglier but faster.
The latency tax also affects cash-out timing. If you’re holding a position and a try is scored against you, the cash-out price drops immediately on the data feed, but your video feed shows the try happening 7-10 seconds later. By the time you see the try and reach for cash-out, the cash-out price has already collapsed. The “I’ll cash out if they score” strategy is mechanically defeated by the latency tax — by the time you see the score, the price is already gone.
One specific operational tip: turn off the audio commentary on your video stream. Commentators sometimes deliver excited “they’re going to score!” calls a beat or two before the event happens. That beat is your warning signal. It doesn’t close the 7-10 second gap fully, but it shaves 1-2 seconds off the disadvantage, which is meaningful in a market that updates every 1-2 seconds.
The live markets catalogue, sorted by usability
UK books offer a wide catalogue of in-play rugby markets, but only a subset of them are actually usable for an edge-seeking bettor. Most live markets exist to provide volume and entertainment, not value. The ones I use regularly are a much shorter list than the ones I see on screen.
Match-winner in-play. This is the headline market and the deepest. It updates continuously, with the price reflecting current score, time remaining, and field position. The match-winner in-play is genuinely useful for entry points after specific events (sin-bins, key turnovers) where the model’s reaction is mechanical and the actual game state has shifted more than the model accounts for.
Live handicap. The handicap line updates throughout the match as the score and time remaining change. The interesting feature of live handicap is that the line itself moves — a side that started at -7.5 might be -3.5 by half-time if they’re tied on the scoreboard. That means the cover threshold migrates throughout the match. A “back the home side -7.5 live” bet at 60 minutes is a different product than the same bet at 5 minutes.
Live totals. The total points line updates as the score progresses. The interesting alternative is the “next 10 minutes” totals — how many points scored in a specified 10-minute window — which lets you bet on game state rather than full-match outcome. This market has soft pricing on books that don’t specialise in rugby, and the edge available is sometimes substantial in the 30-50 minute window when the game is settling into a pattern.
Next score market. Which side scores next? This is the fastest-moving in-play rugby market. It updates with every change of possession, every penalty, every line break. The market closes briefly after every score and reopens with new pricing. The edge here comes from anticipating the next-score outcome based on field position — sustained pressure inside the opposition 22 dramatically tilts the next-score probability, and the public sometimes underprices that.
Race-to markets. Race to 10, race to 20, race to 30. These markets settle as the running score crosses the threshold. The live versions update with the score, and the interesting angle is the live “race to current total +10” bet that lets you take a side that’s behind on the scoreboard at a fair price for the next scoring window.
Anytime try scorer in-play. The try scorer markets update throughout the match, with prices on players who haven’t scored yet shortening as the match progresses and the time-to-score-a-try window narrows. The interesting in-play angle is on forwards who haven’t scored yet but are being set up by sustained team possession in the opposition 22. Those prices sometimes hold longer than they should before the model adjusts.
The markets I deliberately don’t bet in-play are: half-time/full-time, drop goal yes/no, sin-bin counts. These have wider overrounds, slower price discovery, and less volume than the headline markets, which means edge is harder to find and harder to execute when found.

Key game moments for live entry
The best in-play positions don’t come from random fluctuations. They come from specific game moments where the model’s mechanical reaction differs from the actual game state shift. After 9 years of live betting, I’ve identified four moments that consistently produce edge windows.
First moment: the post-try restart. After a try is scored, the match-winner price moves by 15-25 points based on the scoreline shift. The model recalculates instantly. But the actual game state shift is sometimes larger than the score shift — a side that scores their second try in 8 minutes has built momentum that the model captures only partially. The interesting position is backing the recently-scored side in the next-score market or live handicap, immediately after the conversion attempt is taken. The window lasts about 60-90 seconds before the model catches up.
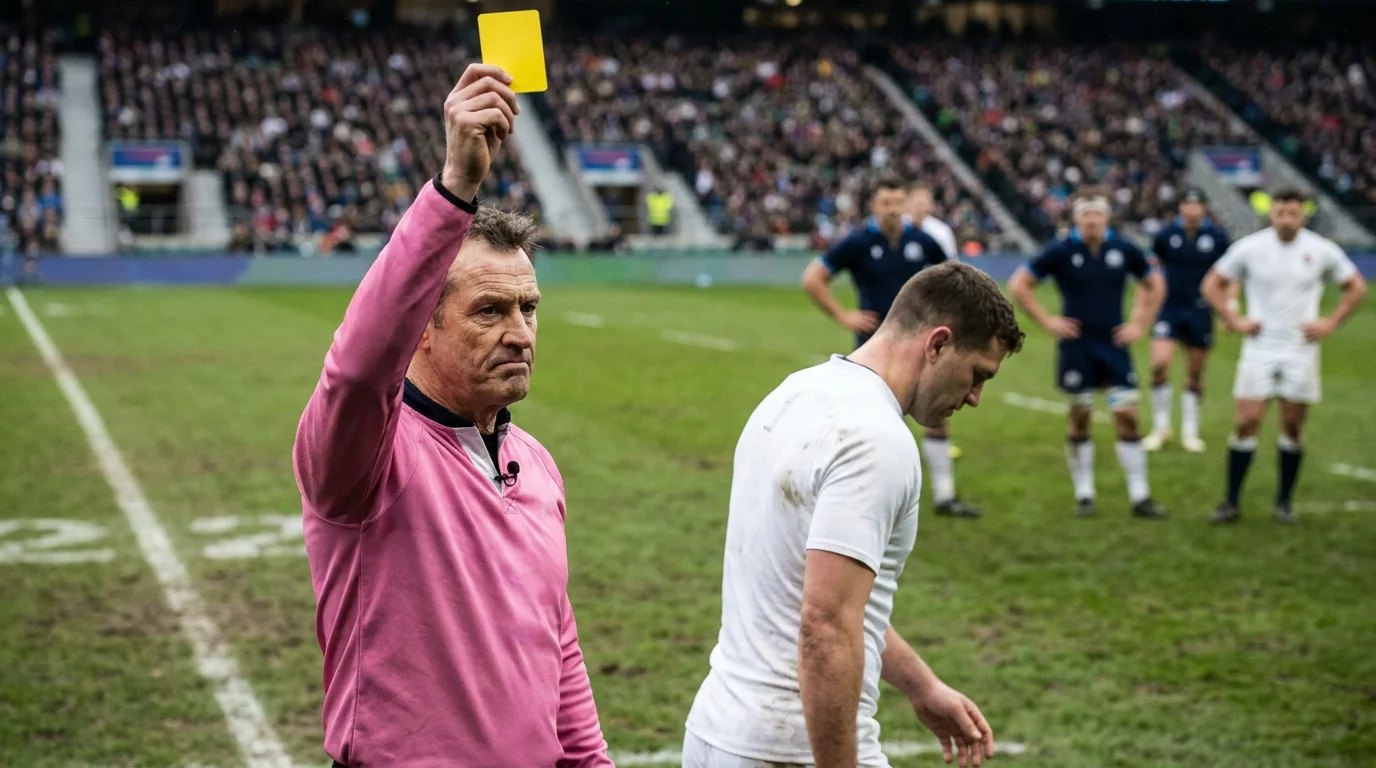
Second moment: the sin-bin window. A yellow card produces a 10-minute period where one side plays with 14 instead of 15. The model adjusts the match-winner and totals lines immediately, but the actual disadvantage of playing a man down varies based on the game state — early in the match, late, with field position, against specific opponents. The price the model publishes for the sin-binned side is sometimes too short relative to actual outcome rates, particularly when the sin-binned side is at home and has scrum dominance. The live entry on the disadvantaged side, immediately after the card, sometimes produces edge over the next 5-7 minutes.
Third moment: the post-half-time first possession. Sides return from half-time with adjustments, and the first possession of the second half often reveals which side’s coaches have made the better tactical changes. The live handicap and totals lines start the second half at the half-time pricing and adjust over the first 5 minutes. The 5-minute window after the second-half kick-off is the cleanest live entry point for handicap bets, because the model has had no in-second-half data to recalibrate yet.
Fourth moment: the 70-minute pressure window. Most rugby matches enter a decisive phase between 65 and 75 minutes, when the leading side has to decide whether to manage the clock or push for more, and the trailing side has to decide whether to chase the bonus point or the win. The live pricing during this window often lags the actual tactical posture. A trailing side playing for the bonus point will accept a higher loss margin in exchange for the four-try bonus, which inflates the over-totals price and the trailing side’s spread cover at the same time. The 70-minute pressure window is one of the cleanest cross-market edges in live rugby betting.
These four moments don’t appear in every match. Some matches are blowouts where there’s no sin-bin, no post-try momentum shift, no late pressure window. The skill is patience — waiting for the moments rather than betting through the dead phases. Across a Premiership weekend with eight matches, I might find four to six legitimate live entry points. The other 60-plus opportunities I see on screen are skip calls.
Using cash-out responsibly and when not to
Cash-out lets you settle a bet before the underlying market resolves, at a price set by the bookmaker that reflects the current win probability minus a margin. It’s marketed as a tool for locking in profits or limiting losses, and in some specific situations, it’s exactly that. In most situations, it’s a margin extraction tool that benefits the bookmaker more than the bettor.
The cash-out price is structurally below the fair value of the position. The bookmaker calculates the current implied probability of your bet winning, multiplies by your potential payout, and subtracts a margin (typically 3-8 percent depending on the book and market). That margin is the cash-out tax. Over a sample of cash-outs taken at fair-value moments, you give back 3-8 percent of expected value per cash-out.
The mathematical case for cash-out exists in specific situations. First: when your view of the underlying probability has changed since you placed the bet, in a way that makes the current cash-out price better than your revised expected value. For example, you backed England -7.5 pre-match, England are -3.5 live at 30 minutes, but you now think Wales will mount a serious comeback. If the cash-out price is positive and your revised probability says the bet now loses 60 percent of the time, taking the cash-out is mathematically correct.
Second: when bankroll constraints make variance reduction more valuable than expected value preservation. A bet representing 5 percent of your bankroll might be worth cashing out at slightly below fair value if the variance of the remaining position would otherwise destabilise your portfolio. This is a Kelly-criterion adjacent argument and applies more to large-stake bets than to small ones.
Third: when the partial cash-out feature lets you bank a guaranteed return on part of the stake while letting the rest ride. This is the most genuinely useful cash-out application. Partial cash-out at 75 percent of the stake, with 25 percent let-it-ride, can lock in profit while preserving upside on the original thesis. It’s still a margin tax on the cashed-out portion, but the structure makes sense if you’re confident about the partial-versus-full position.
The reasons not to cash out: when the underlying position is still positive expected value at the current price; when your view of the probability hasn’t changed; when you’re being driven by recency bias from the most recent event in the match rather than the actual remaining time and game state. Most live bettors take cash-out for psychological reasons (anxiety about losing), not mathematical ones. That’s the cash-out tax in action.
For the full mechanical breakdown of how bookmakers price cash-out, when partial outperforms full, and where auto cash-out triggers help or hurt, the deep dive on the full cash-out strategy guide walks through the math in detail.
Live betting pitfalls, biases and where bettors lose money
Live rugby betting concentrates every behavioural bias in sports betting into a 80-minute window. Recency bias, anchoring, loss aversion, the gambler’s fallacy, narrative-driven decision-making — they all show up, and they all cost money. The structural design of live betting platforms intensifies these biases through fast feedback loops, visual emphasis on price changes, and the constant availability of new markets.
Dr Raffaello Rossi at the Bristol Hub for Gambling Harms Research, commenting on the broader UK gambling landscape, put the structural problem starkly: “Year on year, the problem seems to get worse, despite the industry’s promises of better self-regulation. The Premier League is now so saturated with gambling marketing that brands are fighting each other for every inch of advertising space. The evidence is now overwhelming: self-regulation has failed.” That comment is about football marketing, not rugby specifically, but the same dynamic applies to live rugby betting — the structural pressure to bet more, faster, on more markets, is the dominant force the in-play platform applies to its users.
The specific biases that cost live rugby bettors money:
Recency bias. The most recent event in the match feels more important than it is. A try scored 30 seconds ago has the same mathematical weight in calculating remaining win probability as a try scored 30 minutes ago — but the recent try feels much more decisive. Live bettors over-bet on the side that just scored, and under-bet on the side that hasn’t recently.
Chasing losses. After a losing bet in the same match, there’s a strong pull to make another bet on the same match to “recover.” The next bet is rarely sized rationally — it’s sized to recover the loss. The structural setup of in-play platforms (the same match still live, more markets available) makes loss-chasing easier than in pre-match betting where the next bet would be on a future match.
Stake creep. Live bets are often smaller than pre-match bets, which makes them feel less consequential. Across an 80-minute match with 10-12 small live bets, the total stake can exceed what the bettor would have placed as a single pre-match position. The cumulative loss from stake creep is the most common pattern I see in bettors who started “just dabbling” with live betting.
Cash-out anchor. The cash-out value displayed prominently on screen functions as an anchor that shifts the bettor’s perception of the bet’s current value. A bet that’s at +50 percent cash-out feels different to a bet at -20 percent cash-out, even if both are at the same expected value relative to fair price. The cash-out display nudges bettors towards taking cash-out more often than is rational.
The mitigations for these biases require structural discipline, not willpower. Pre-set stake limits that don’t allow you to escalate. Pre-decided live entry criteria that you commit to before the match starts. Reviewing the day’s bets after the match, not during. Forced cooling-off periods between same-match bets. These are operational tools, not psychological tricks, and they’re the only reliable defence against the biases that the live betting platform structurally activates.

Mobile live betting and what the 70 percent share means
Mobile betting accounts for roughly 70 percent of all sports betting activity, and the mobile share of live betting is even higher — closer to 80 percent on UK-licensed bookmaker apps. That concentration of live betting on mobile devices has specific consequences for in-play rugby strategy.
Mobile streaming has higher latency than desktop streaming. The mobile app’s video stream typically runs 8-12 seconds behind the actual event, where a desktop browser stream might run 6-9 seconds. That extra 2-3 seconds of latency is a meaningful disadvantage when the betting market updates every 1-2 seconds. Mobile bettors are betting on data 1-2 update cycles behind the model.
Mobile interfaces also condense the information available compared with desktop. The price displays, the live match centre data, the alternative market options — all compressed to fit a smaller screen. That compression makes it harder to compare markets, harder to verify pricing across alternatives, harder to think carefully about a position. The faster execution that mobile enables comes at the cost of slower decision-making.
The mobile bet-button placement is also a behavioural design element worth being aware of. The bet button on most UK bookmaker apps is placed within thumb reach, often near the centre or right side of the screen, with minimal friction between price view and stake confirmation. That low-friction execution path is great for bookmaker volume and not great for bettor discipline.
For the UK rugby bettor specifically, the practical implications of the mobile share are: use desktop for live betting when you have the option, accept the latency tax when mobile is your only option, and treat the mobile bet button with structural discipline (pre-set stake limits, pre-decided entry criteria). The 70 percent share isn’t going away — mobile is the dominant in-play channel for the foreseeable future — but the structural disadvantages can be managed if you treat them as the constraints they are.
The other side of the mobile share story is positive: live in-play volume in rugby has grown substantially because mobile betting made it accessible. The Sports4Cast and Smart Betting Club data suggest that rugby has delivered ROI of 10.54 percent across 485 bets in a 12-month independent review window. That ROI was generated across both pre-match and live formats. Some of it is structural — rugby markets remain less efficient than football or basketball markets — and some of it is the growth of mobile platforms that has expanded the in-play opportunity set. Both factors point to live rugby betting being a viable edge-finding market for the disciplined bettor.