
Betfred Super League Betting: Markets, Grand Final and Form-Based Strategy
 Available in US
The 2025 Super League season produced something I’d been waiting on for a decade. Regular-season total attendance hit 1,698,022 across the league, with an average of 10,229 per match. That’s the first time average regular-season attendance has cleared 10,000. Combined with a 52 percent year-on-year jump in TV audience between 2024 and 2025, Super League finally has the commercial weight to push UK rugby league out of “niche market” status. For bettors, that means deeper markets, sharper pricing, and a competition that can no longer be dismissed as a smaller version of the Premiership.
I’ll be honest about something here. My early Super League betting in the late 2010s was bad. I treated it like Union, applied Union heuristics, and got punished. The two codes are different sports with different markets, and the cleanest insight I can give a bettor coming to Rugby League from Union is: throw out the Union priors for the first ten matches. Watch the rhythm. Notice the scoring patterns. Then start betting.
This guide covers Super League betting end to end. The format and the loop-fixtures quirk that distorts the table. The match betting markets that are specific to the 13-a-side game. The points-and-tries totals where the math runs differently from Union. The Magic Weekend that compresses six matches into one venue across two days. The audience and TV context that’s reshaping market depth. The Grand Final at Old Trafford that concentrates the season’s commercial weight. And the integrity framework — Sportradar monitoring, the RFL’s anti-corruption work — that gives UK Super League betting more structural protection than most international markets.
What runs through all of it is the central fact: Super League is a faster sport than Union, with more possession changes, more scoring opportunities, and tighter score lines. Those facts shape every market on the board.
Super League format and the loop fixtures quirk
If you’ve come to Super League from Union, the format is the first thing to get straight. Twelve clubs in the current cycle. A regular season of 27 rounds. Each club plays every other club home and away (that’s 22 fixtures), then has 5 additional “loop fixtures” against selected opponents. The top six teams qualify for the playoffs. The playoffs run through eliminator and semi-final stages to a Grand Final at Old Trafford.
The loop fixtures are where new bettors get confused. They’re additional matches against specific opponents — historically rivals or geographically close clubs — that don’t follow the home-and-away balance of the main 22. A club might play their nearest rival three times in a season (twice in the main schedule, once as a loop). That changes the strength-of-schedule calculation for the table and creates fixture types that wouldn’t exist in a pure round-robin format.
For betting, the loop fixtures matter in two ways. First, the rivalry-loop fixtures (Wigan-St Helens being the classic) are higher intensity than the main-schedule fixtures between the same clubs, which lifts the match-winner pricing for the home side and tightens the handicap. Second, the loop fixtures against weaker opponents are the matches where rotation risk is highest — a top side might rotate aggressively against a bottom-three loop opponent, especially in the final third of the regular season.
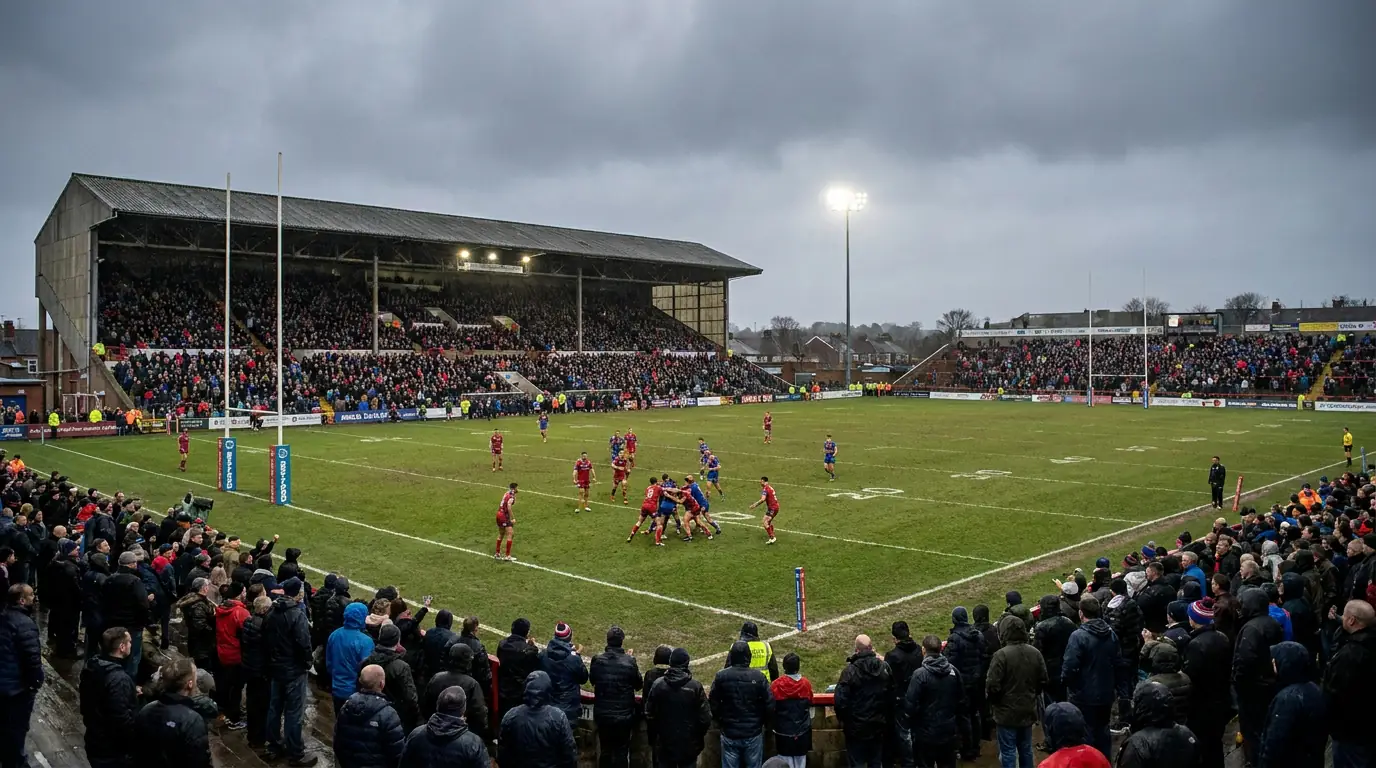
The 2025 regular season produced 1,698,022 total attendance across the loop-fixture-inclusive schedule. The average of 10,229 per match was driven up by the marquee loop fixtures and the headline Saturday evenings on Sky Sports. The bottom-tier fixtures — Tuesday night midweek matches between two struggling clubs — pulled crowds well under that average and produced betting markets with shallower depth.
The 2024 baseline for comparison: average attendance of 9,193, total of 1,594,135, with Mikey Lewis as the season’s top points scorer at 216 points. The 2024-to-2025 growth in attendance, combined with the 52 percent TV audience growth, marks a structural step-change for the competition. Markets get deeper when the audience grows. Bettors should price that into their expectations of liquidity going forward.
Rugby League match betting markets, the specifics
The first thing that throws Union bettors when they look at a Super League match card is the scoring system. A try is worth 4 points, not 5. A conversion is 2. A drop goal is 1. A penalty goal is 2. The reduced try value compresses the scoring distribution — fewer extreme scorelines, more tight finishes — and shifts where the totals lines sit.
A typical Super League match total points line runs from 38.5 to 54.5, depending on matchup. The average match produces somewhere in the mid-40s in points. That’s structurally similar to Union, but reached through a different scoring pattern: more tries scored per match in Super League (roughly 7-8 on average versus 6 in Union internationals), with each try worth one fewer point. The math nets out to a similar total, but the over/under tries line in Super League runs higher — 7.5 or 8.5 most weeks.
The match-winner market in Super League is three-way (home/draw/away) on most UK books, though draws in Super League are extremely rare — far rarer than in Union, because the 80-minute Rugby League match almost always produces a clear winner. The draw price on a Super League fixture sits around 25/1 or longer, which is roughly fair given the underlying draw rate of around 2-3 percent.
The handicap market is where the structural difference between Union and Rugby League shows clearly. About 60 percent of all rugby bets globally — across both codes — concentrate in match outcome and margin markets, and Super League follows that pattern, but the typical handicap line is tighter than the equivalent Union fixture because the scoring distribution is more compressed. A top-three Super League club hosting a bottom-three opponent might be -10.5 on the handicap, where the equivalent Premiership fixture might be -13.5. Don’t apply Union handicap intuition to Super League. Recalibrate to the tighter distribution.
Double chance markets (1X, X2, 12) are deeper in Super League than in Union, because the draw price is shorter relative to the implied probability. The 12 market — which pays out if either side wins — is functionally a “no draw” bet, and on Super League fixtures where the draw is genuinely fairly priced, the 12 is sometimes useful as a low-variance position.
Race-to markets (race to 10, race to 20) work differently in Super League than in Union. The 13-a-side game produces faster early scoring on average, which means the race-to-10 market settles earlier in the match than its Union equivalent. The pricing is correspondingly tighter, but the alternative race-to lines (race to 14, race to 16) sometimes have value when the public has loaded onto the round-number lines.
Try scorer markets in Super League are deeper than in Union — there are more tries scored per match, so anytime try scorer becomes a high-frequency market with prices on most of the matchday 17. First try scorer is a market where the public bets the marquee names, leaving value on the back-rows and second-row forwards who score from short-distance forward play.
Points and tries totals, where the math runs differently
The 2024 Super League season saw Mikey Lewis lead all scorers with 216 points across the regular season. That single fact — the top scorer cleared 200 points — tells you how kicking-heavy the modern Super League scoring distribution is. Even with tries worth only 4, a top fly-half or kicking centre can clear 8-10 points per match through conversions and penalties.
The totals line on a Super League match is structurally different from Union. The points-per-try is lower, but the tries-per-match is higher. The net total comes out similar (mid-40s on average), but the distribution is tighter around the mean. There are fewer 60-point matches and fewer 20-point matches than in Union. That tightness changes how you price the alternative totals lines.
The most reliable totals edge in Super League is on weather-affected matches. Heavy rain in a Super League fixture compresses the tries-per-match number more than in Union, because the 13-a-side game depends more on slick passing across the line. Wet weather pushes the over/under tries line under by 1.5 to 2 tries on average — a larger absolute shift than in Union, even though the raw try counts are higher. UK books price weather, but they often don’t price it aggressively enough until 12-18 hours before kick-off.
Team totals are deeper markets in Super League than in Union. A typical Super League fixture has both team totals available (home team total points, away team total points), plus alternative team totals at multiple lines. The team total markets are where I find the cleanest edges, particularly on fixtures where one side has a clearly stronger attack and the public bets the match total without dissecting which side will score.
The drop goal market — yes/no whether a drop goal is scored in the match — is a Super League-specific edge. Drop goals are more common in Rugby League than in Union, because the one-point drop goal is a tactical tool used to settle close late-game situations. The yes/no drop goal market on a close-priced match sometimes runs at 5/4 yes, which on the implied probability is too long given how frequently late-game drop goals decide tight Super League finishes.
The first try scorer market warrants specific attention in Super League because of the position weighting. The number 11 left-wing and the number 14 right-wing positions account for a disproportionate share of first tries, but the public knows this and prices accordingly. The interesting first try scorer angle in Super League is the centre — number 3 or number 4 — who breaks the defensive line off a backline move. The centre at 14/1 first try scorer, when the opposing defensive midfield is missing a key tackler, is often a position worth taking.

Magic Weekend, six matches in one venue
Magic Weekend compresses six Super League fixtures into one venue across two days, usually in late May. It’s the closest thing Rugby League has to a festival format — every Super League club plays one match across the weekend, on a single stadium pitch, in front of a combined crowd that often exceeds 50,000 across the two days.
The betting characteristics of Magic Weekend are unusual. The same pitch and conditions across all six matches mean weather and surface factors are constant across the slate. That’s information bettors can exploit. If the first match of the weekend produces 9 tries and a total of 56 points, the subsequent matches inherit some of that pitch-and-conditions signal — though clubs adjust gameplans in response, so the carry-over isn’t direct.
The same-venue effect also flattens home advantage to zero. Every match is effectively neutral, with the only “home” advantage being the geographic location of the stadium (it rotates between hosting cities) and the relative crowd support for each club. The handicap markets adjust for this — Magic Weekend handicaps are typically tighter than the same fixture would be at the higher-seeded club’s home ground.
Magic Weekend is also the highest-attention Super League weekend of the regular season. Public money concentrates, market depth grows, and the secondary markets (try scorer, totals, race-to) get sharper than usual. The headline markets are usually priced within 1 percentage point of fair, leaving the value in the less-bet markets. My Magic Weekend strategy is to skip the match-winner and handicap markets entirely, and concentrate on the team total tries and the first-half/second-half splits, where the public engages less precisely.
The fixture schedule across the weekend matters for the late-Sunday games. Sides playing the Sunday evening fixture have watched the earlier matches and might adjust tactics in real time. The bookmaker handicap lines for the Sunday evening matches sometimes drift slightly to account for this, which is the right adjustment but often slightly overdone. The favourite-side cover rate in the Sunday late slot has historically run slightly ahead of expectation.
Audience, TV context and what 2025 changed
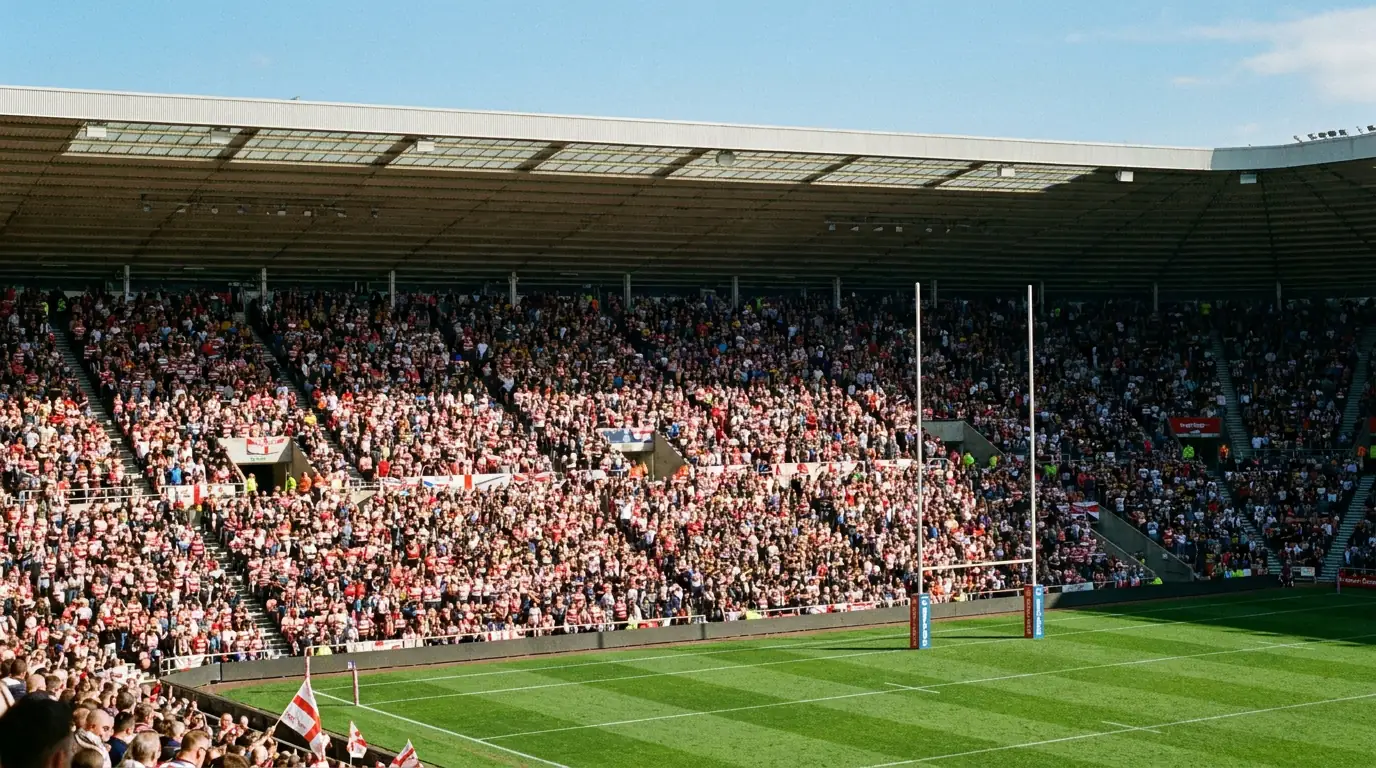
The 52 percent year-on-year TV audience growth for Super League in 2025 — combined Sky Sports and BBC coverage — is the most consequential commercial development in Rugby League this decade. That kind of jump doesn’t happen organically. It reflects scheduling decisions, broadcast investment, fixture restructuring, and the cumulative effect of a competitive season that ran to the last weekend before the Grand Final.
For bettors, the audience growth has two practical consequences. First, market depth on Super League fixtures is now meaningfully deeper than it was 18 months ago. UK books offer more alternative handicap lines, more try-scorer options, more team-total variations than they did in 2023. The shallower the market, the slower the price discovery and the larger the edge a careful bettor can find. The deeper the market, the harder it is — but the higher the volume you can put on a specific edge before it closes.
Second, the audience growth changes how public money flows through the week. Saturday evening Sky Sports fixtures get the bulk of public engagement, with smaller volumes on the Friday and Sunday matches. The marquee Saturday matches now have pricing efficiency comparable to mid-tier Premier League football fixtures. The midweek fixtures retain the structural softness of lower-volume matches.
For the deeper comparative work on how Union and League differ as betting products — scoring patterns, market availability, totals math — the breakdown of the full Rugby Union vs Rugby League betting comparison covers the structural distinctions that affect every market on the board.
The other audience-driven shift is the broadcast partner mix. The current Sky Sports plus BBC arrangement provides free-to-air coverage of selected Super League matches, which pulls in audiences who don’t subscribe to pay-TV. The free-to-air matches see different public-money characteristics than the Sky Sports-exclusive matches — more casual bettors, more rounded-up prices on the match-winner and handicap markets, and slightly softer secondary markets. The BBC-fixture pricing is one of the soft spots in the 2026 season’s calendar.
The Old Trafford Grand Final and its specific dynamics
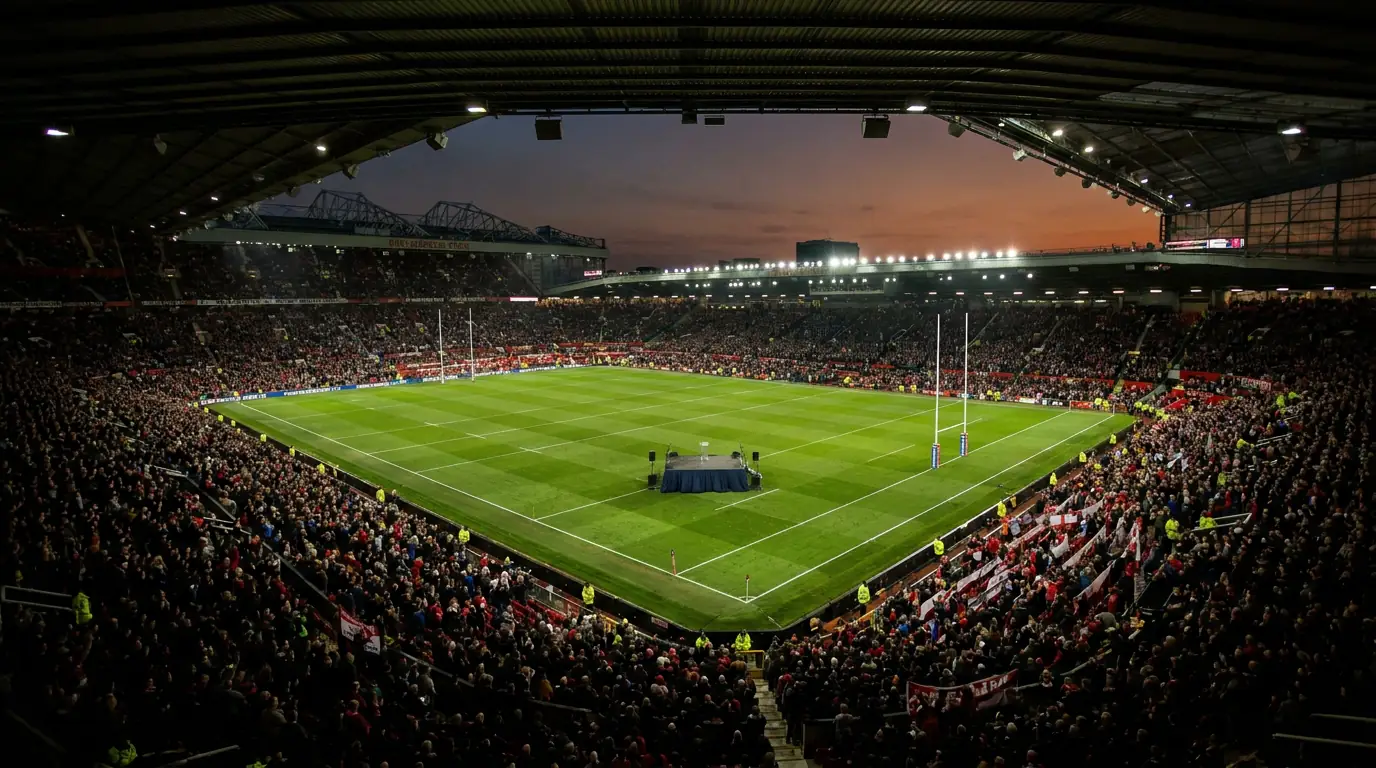
Hull KR beat Wigan in the 2025 Grand Final at Old Trafford in front of 68,853 spectators. That attendance — combined with the cumulative TV audience and the commercial weight of the fixture — makes the Grand Final the single largest betting market in the Super League calendar.
The Grand Final is a neutral-venue, single-match knockout. Old Trafford has hosted every modern Super League Grand Final, which means there’s a deep historical record of how the venue plays. The pitch tends to favour ball-in-hand rugby. The atmosphere skews towards whichever club has brought the larger contingent. The handicap pricing typically runs at -3.5 to -5.5 for the higher-seeded side, which is tighter than the same fixture would be at either side’s home venue.
The integrity framework around Super League fixtures is genuinely strong. The RFL signed an Integrity Partnership with Sportradar in 2017 to monitor more than 200 Rugby League matches per season for unusual betting patterns. Karen Moorhouse, then the RFL’s Director of Operations and Legal, framed the commitment at the launch: “At the Rugby Football League we take the integrity of the game very seriously. It is important that everyone within Rugby League, but also those outside our immediate reach, are in no doubt about our commitment to an honest and credible sport.” That mandate has continued through the years since and remains active for the 2026 season.
What does that integrity framework mean for the Grand Final bettor? Practically, it means the Grand Final is one of the most monitored fixtures in UK sports betting. Unusual line movements, large stake patterns, or anomalous in-play activity get flagged in real time. That’s information protection for the bettor as much as for the league. A market that’s actively monitored for integrity is a market where the published prices are more reliably reflective of the actual probabilities, not distorted by inside information.
The Grand Final markets I focus on are the alternative handicap lines and the try scorer specifics. The headline handicap and match-winner are priced within 1 percentage point of fair, and the totals line is similarly tight. The alternative lines — particularly first try scorer for forwards and team total at 4.5 tries or 5.5 tries — are softer, because public volume concentrates on the headlines.
The other Grand Final-specific edge is the live betting in the first 20 minutes. Both sides play conservatively in the opening quarter, the score remains low, and the live handicap line drifts. By the 25-minute mark, the published line has often moved by 1.5 to 2.5 points from kick-off, which creates a window for an informed live bettor to take the side they expected to dominate before the public catches up. That’s a high-variance strategy, but it’s been profitable for me across the last four Grand Finals.
Integrity, Sportradar monitoring, and what the RFL framework means for UK bettors
The 2017 RFL-Sportradar Integrity Partnership formalised what had been an informal monitoring relationship into a structural one. Sportradar’s monitoring covers more than 200 Rugby League matches per season — every Super League fixture, every Challenge Cup match, every international involving England — and flags any unusual betting pattern for investigation.
The framework matters for UK bettors because it provides structural protection against the kinds of integrity failures that would otherwise distort markets. Match-fixing, spot-fixing on specific events within matches, insider trading on team news — these are the categories of integrity risk that monitoring is designed to catch. When the monitoring works (and the public evidence suggests it does), the markets stay clean and the published prices reflect actual probabilities rather than insider knowledge.
The Gambling Commission’s Sport Betting Intelligence Unit (SBIU) is the upstream framework that coordinates monitoring across sports. The SBIU was prominent in 2025 in supporting a match-fixing investigation involving six BBL basketball players — different sport, but the same monitoring infrastructure that covers Super League. That kind of cross-sport coordination is the practical mechanism by which the integrity framework operates.
What does this mean for the bettor’s decision-making? Three practical points. First, the headline Super League markets — match winner, handicap, totals on televised fixtures — are highly monitored and pricing-efficient. Edge-finding requires deeper analysis or specific information advantages. Second, the secondary markets — try scorer, first try scorer, race-to — are less monitored but also less liquid, which means edge survives longer once found. Third, the live betting markets get real-time monitoring, which means anomalous line movements are flagged and sometimes paused, which can affect in-play execution.
The integrity framework also has an indirect effect on the futures markets — Super League outright winner, Grand Final winner pre-tournament. Because the league is well-monitored, futures pricing tends to be less volatile than equivalent international markets that don’t have the same structural protection. That makes Super League futures a steadier futures product than some Union competitions, with less narrative-driven price movement and more form-driven price discovery.