
Gallagher Premiership Betting: Regular Season, Playoff and Final Markets
 Available in US
The Bath-Leicester Premiership final last June pulled in 973,000 average viewers across TNT Sports and ITV1, with a cumulative peak of 1.26 million. Those are records for a Premiership final. I watched it with three rugby-betting friends in a pub in Putney, and the most striking thing wasn’t the rugby — it was that we kept getting interrupted by people we’d never met asking about specific live odds. Premiership rugby has moved from “the sport I bet on quietly” to a market with genuine public engagement. That changes the betting landscape.
Premiership betting is the bread-and-butter market for UK rugby punters. Twenty-two regular-season weekends from September to June. Ten clubs in the current cycle. A four-team playoff at the end with a Twickenham final. Plus the European fixtures, the cup competitions, and the international windows scattered throughout. It’s the most-bet rugby competition in the UK by volume, and it’s the one where I do most of my work week-to-week.
What sets Premiership betting apart from the international game is the sample size and the rhythm. Six Nations gives you 15 matches per year. Premiership gives you 90+. That’s enough matches to build a real model, test it, and adjust. It’s also enough to develop strong priors about specific clubs, specific players, specific fixture types. By the end of any given Premiership season, I’ve made a couple of hundred bets across the competition. Some of them — most of them, in honest accounting — are skip calls. But the ones I do make are informed by 9 years of week-on-week tracking.
This guide walks through the format, the regular-season markets, home advantage and the Saturday scheduling effect, the Christmas period that distorts pricing, the playoff and semi-final betting structure, the Twickenham final dynamics, and the top-scorer and special markets that round out a Premiership weekend. I’ll be specific about where I think the value lives and equally specific about where I don’t bet at all.
Season structure, fixtures, and the betting calendar
Premiership rugby runs from late September to late June, with a regular season that produces 22 matches per club, followed by a four-team playoff. The structure shifted slightly when the league contracted to 10 clubs after the 2022-23 financial reorganisation, but the broad shape remains: home and away against every other club, plus the playoff semis (top-1 vs top-4, top-2 vs top-3) and a Twickenham final.
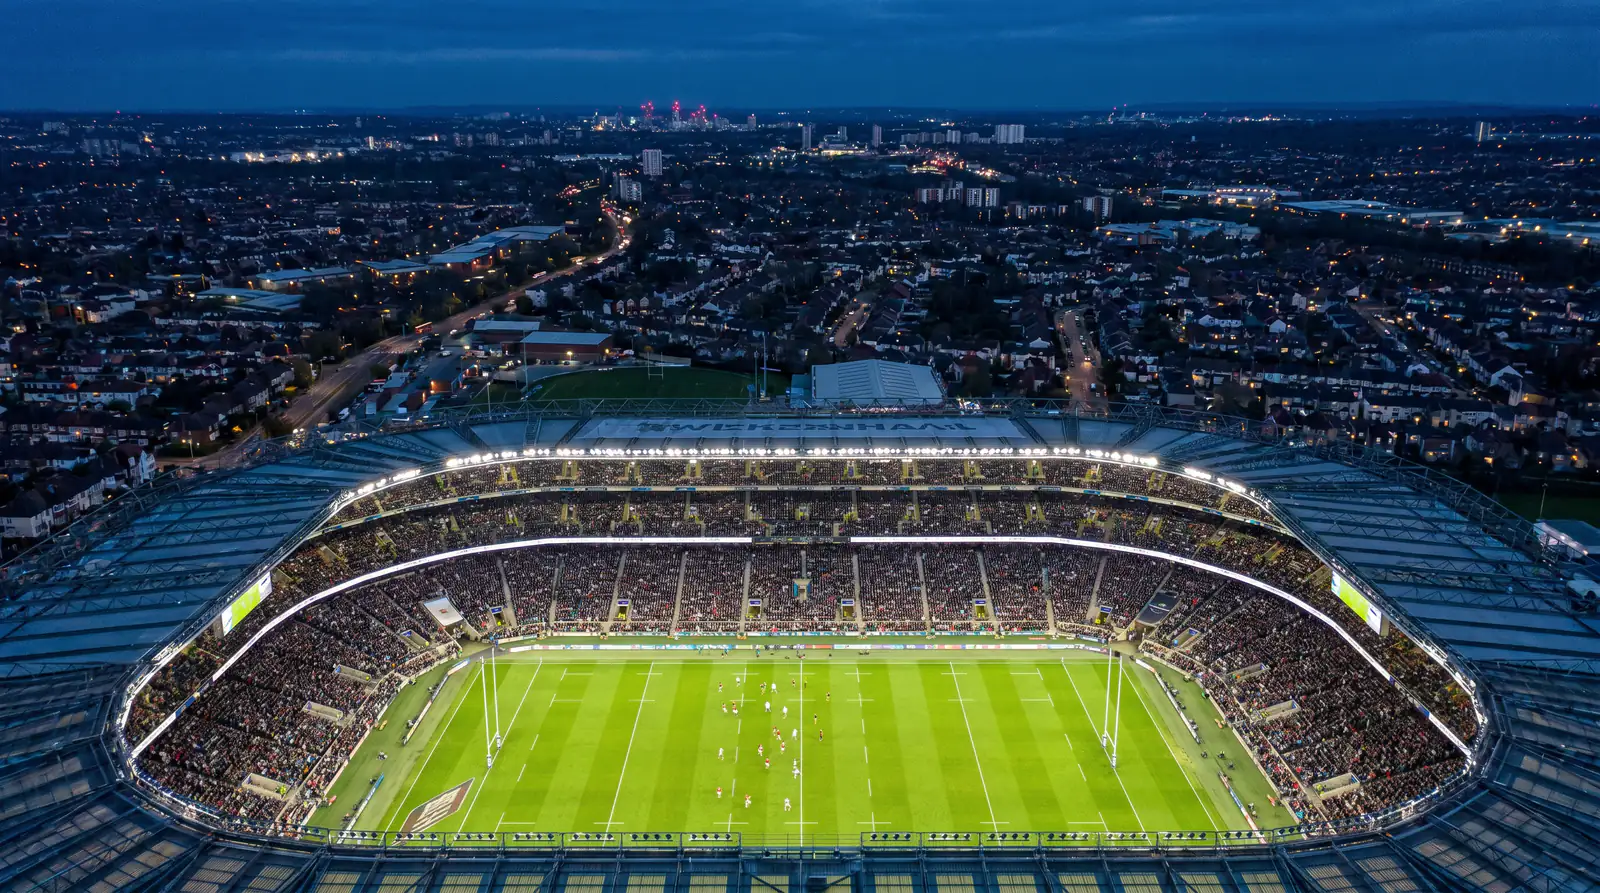
From the 2023-24 season — the most recent full sample — the regular season delivered an average attendance of 15,358 per match, total attendance of 1,428,276, and a maximum single-match attendance of 81,669 at the Twickenham final. Those numbers ground the betting context. The competition’s commercial scale is large enough to support deep markets across every fixture.
The fixture calendar runs in bursts and pauses. The Premiership pauses for the Six Nations window in February and March, with selected fixtures played on weekends without international matches. It pauses for European weekends in October, December, January and April. The Christmas period — the two weeks bracketing 25 December — is a fixture-dense window with derby matches and back-to-back schedules. Then the playoff sprint compresses everything into the final five weekends of June.
For betting purposes, the calendar’s rhythm creates specific windows. The opening weekends of September are soft — clubs are working out combinations, key players are still in pre-season form, and the market is pricing without the most recent data. The post-European pause weekends are sharp — clubs return with European form fresh in the market’s mind, and the line moves fast on team news. The Christmas weekends are the most volatile, with public money concentrating around the derbies. The playoff weekends are the tightest priced.
One scheduling quirk worth flagging: the Friday night Premiership match — typically one fixture per round on TNT Sports — has different betting characteristics than the Saturday afternoon games. It draws a smaller live audience, sits in the bookmaker’s “early” trading window, and tends to have wider lines than the equivalent Saturday match. If I’m looking for handicap or totals value, the Friday night fixture is the first one I check.
Regular-season betting markets and where the action is
The Premiership produces roughly one tight game per round. Across the 2025-26 season analysis I’ve been keeping, around 33 percent of Premiership matches finish with a winning margin between 1 and 7 points. That single statistic shapes everything about how I price the regular-season handicap line.
A 33 percent rate of single-score finishes means the standard handicap line of “favourite -7.5” is right on the cusp of the distribution. Half the time, the favourite either wins by 8+ (covering) or by 1-7 (failing to cover by a single try). The other half is split between losses and exactly-seven-point margins. That’s a market where the line is centred precisely on the boundary of the most common outcome — which is what good handicap pricing looks like, but which also means small errors in player availability or weather translate into significant cover-rate changes.
The markets I bet most often in the regular season are: match handicap (where the line sits at the boundary of distribution), total points (where the line moves predictably with weather and fixture type), and try scorer markets (where the public consistently underprices forwards).
Match-winner three-way is a market I rarely bet pre-match. The draw price is fat for the same reason as in international rugby — draws are rare but rounded up by public pricing. The home/away question is usually answered correctly by the market within 1-2 percentage points of fair. Where I do bet match-winner is in specific fixture types: a struggling club coming off a European loss against a top-six club at home, where the public underprices the home side’s bounce-back potential.
Total points markets in the Premiership run from about 38.5 to 55.5 depending on matchup. The average is around 47, which is consistent across the last three seasons. Weather moves the total points line by 4-7 points in heavy rain, and by 2-4 points in wind. Team news moves it less — typically 1-3 points for a single key player out. The over/under tries line runs from 4.5 to 6.5 most weeks, with the higher end reserved for matches involving the more attacking sides (Bath, Sale, Harlequins in current form).
The try scorer markets are where the regular Premiership bettor’s edge most consistently lives. Anytime try scorer on a back-row forward starting in a fixture against a leaky defence is one of the most reliably underpriced bets on the board. The public bets wingers and outside centres. The bookmaker prices accordingly. The back-row at 9/4 or 5/2 anytime, against a club shipping five tries a game, is a position worth taking weekly when the matchup is right.
Asian handicap and alternative handicap lines are the cleaner versions of the standard handicap markets. Asian handicap removes the push possibility by quartering the line, and alternative handicap gives you finer control over the cover threshold. UK books offer both, with depth varying by fixture. The Friday night and Sunday afternoon fixtures tend to have shallower alternative lines than the Saturday afternoon marquee match.
Home advantage and the Saturday-after-Premier-League effect
The average Premiership attendance over the 2024-25 season grew 10 percent on the 2023-24 baseline, and matches scheduled on Saturday after the Premier League window drew 47 percent more TV audience than the equivalent non-Premier League weekends. That second number is the most underappreciated betting statistic in Premiership rugby.
What does “Saturday after Premier League” mean for betting? Higher TV audience pulls more public money into the bookmaker pools, which tightens the marquee markets and widens the secondary ones. The fixture itself doesn’t change — but the way money flows around the fixture changes substantially. The handicap and match winner on the marquee fixture get priced down to within 1-2 percent of true. The try scorer and totals markets on the same fixture have more slippage. Bet the secondary markets, skip the primary, when the audience is high.
Home advantage in the Premiership runs at about 64 percent across the 2025-26 sample I’ve been tracking. That’s a few percentage points higher than international rugby, which makes sense — club fans travel less than international fans, the home crowd is more consistently partisan, and the away side often arrives with a shorter turnaround if the previous fixture was European. The 64 percent rate translates to a handicap line of about -3.5 to -5.5 for the average home favourite, depending on opponent quality.
The clubs with the strongest home records over the last three seasons are Saracens, Bath, and Northampton, in that order. Each runs around 70-75 percent at their home ground in seasons where they’re playoff contenders. The clubs with the weakest home records are typically the bottom-three sides — though “weakest” here means around 50 percent, which still tilts the handicap meaningfully. There is no club with a genuinely weak home record in the current Premiership. The bottom of the table is competitive enough that home venues matter for everyone.
The home advantage I’d flag for specific attention is Sale at the AJ Bell Stadium. Their home record fluctuates more than any other club’s — they can run a stretch of 8 home wins from 10 in good form and drop to 4 from 10 in a bad cycle. The public tends to price Sale at home on the average rather than the current form. When they’re in a good cycle, the home handicap line is too generous to the visitor. When they’re in a bad cycle, it’s too tight. The form-driven adjustment is real.
The Christmas fixtures and what they do to pricing
The 2024-25 Christmas window pulled in 2.6 million viewers across the festive Premiership rounds — a record, eclipsing the previous 1.8 million from 2023-24. That number tells you something specific about how the Christmas period reshapes the betting market.
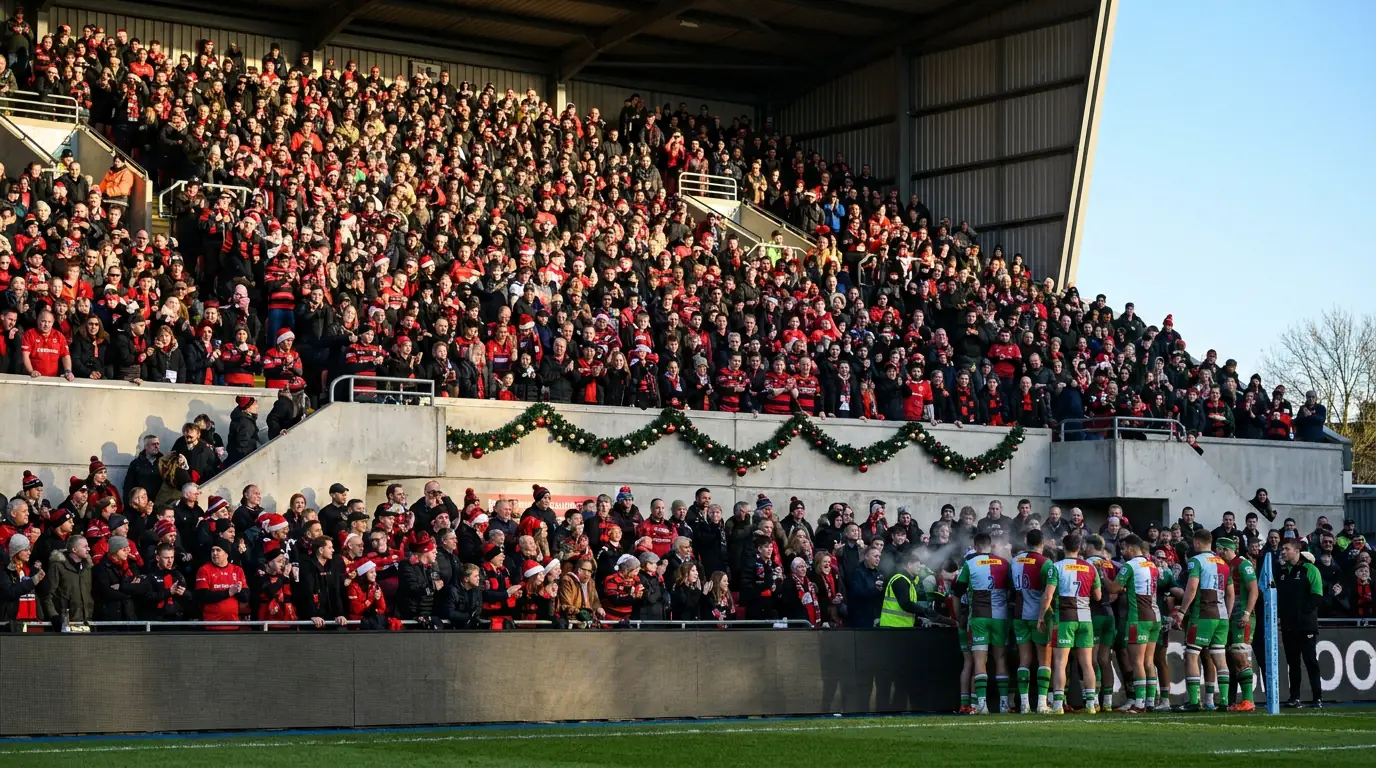
The Christmas fixtures are typically derby matches, played on Boxing Day and the weekend after New Year. Bath-Bristol, Northampton-Leicester, Harlequins-Saracens — the rivalries that produce the highest base attendance get scheduled into the Christmas window. The combination of derby intensity, holiday TV audience, and the dense back-to-back fixture schedule produces betting markets that look different from the rest of the season.
Derby pricing is where I see the most consistent public-money distortion in the regular season. The home side in a Premiership derby is often priced shorter than the underlying probability suggests, because the public bets the home side in derbies almost reflexively. The away handicap value in Christmas derbies — backing the visitor +5.5 or +7.5 — is one of the cleaner edges I track year after year.
The back-to-back fixture schedule (Boxing Day and the following weekend) also produces rotation risk that’s not fully priced. Squads use the Christmas window to rotate front rows, second rows, and back rows aggressively. The published team news comes 24-48 hours before kick-off, and the line moves on it — but the public bets the brand of the club, not the specific XV. That’s where the post-team-news bet on the second-fixture rotation patterns can find value.
The Christmas fixtures are also when the cumulative tiredness of European pool play starts to show. Clubs that had two consecutive Champions Cup weekends in November and December often look heavy-legged on Boxing Day. The handicap and totals line don’t always reflect that until 48 hours before kick-off.
Playoff and semi-final betting structure
The Premiership playoffs work on a four-team format: the top four sides at the end of the regular season qualify, with the table-toppers earning home semi-final fixtures. The top seed plays the fourth seed; the second seed plays the third. Winners advance to a Twickenham final.
The semi-final markets are tight but not as tight as the final. There’s still some variance in how the public weights “current form” against “regular-season form,” which gives a model-based bettor space to operate. A side that finishes the regular season on a hot streak but had a mediocre middle stretch often gets priced too short in the semi-final on recency bias. A side with steady season-long form and a quiet final fortnight sometimes drifts to a price that doesn’t reflect their underlying strength.
The semi-final home advantage is structurally large because the higher seed plays at their home ground. Across the Premiership semi-finals of the last three completed seasons, the home side has won roughly 70 percent — higher than the 64 percent regular-season home rate. The combination of higher seeding (better team), home venue (more support), and playoff stakes (more discipline) compounds into a meaningful advantage. The market prices about 65 percent of that, leaving a sliver of value on the home side at fair price.
The handicap line in semi-finals usually sits around -3.5 to -5.5 for the home favourite. That’s tighter than the average regular-season fixture between the same two clubs would be — playoff lines are compressed because the public is more uniformly aware of both sides’ strength. The interesting handicap angle in playoffs is the underdog cover, particularly when the underdog is a fourth seed coming off late-season form and the top seed has had a quiet final fortnight.
The largest single attendance recorded in the 2023-24 Premiership season was 81,669, at the Twickenham final. That fills out the picture: the playoffs concentrate the season’s commercial weight onto three matches across two weekends. The bookmaker pricing reflects that concentration.
The Twickenham final and its specific market dynamics
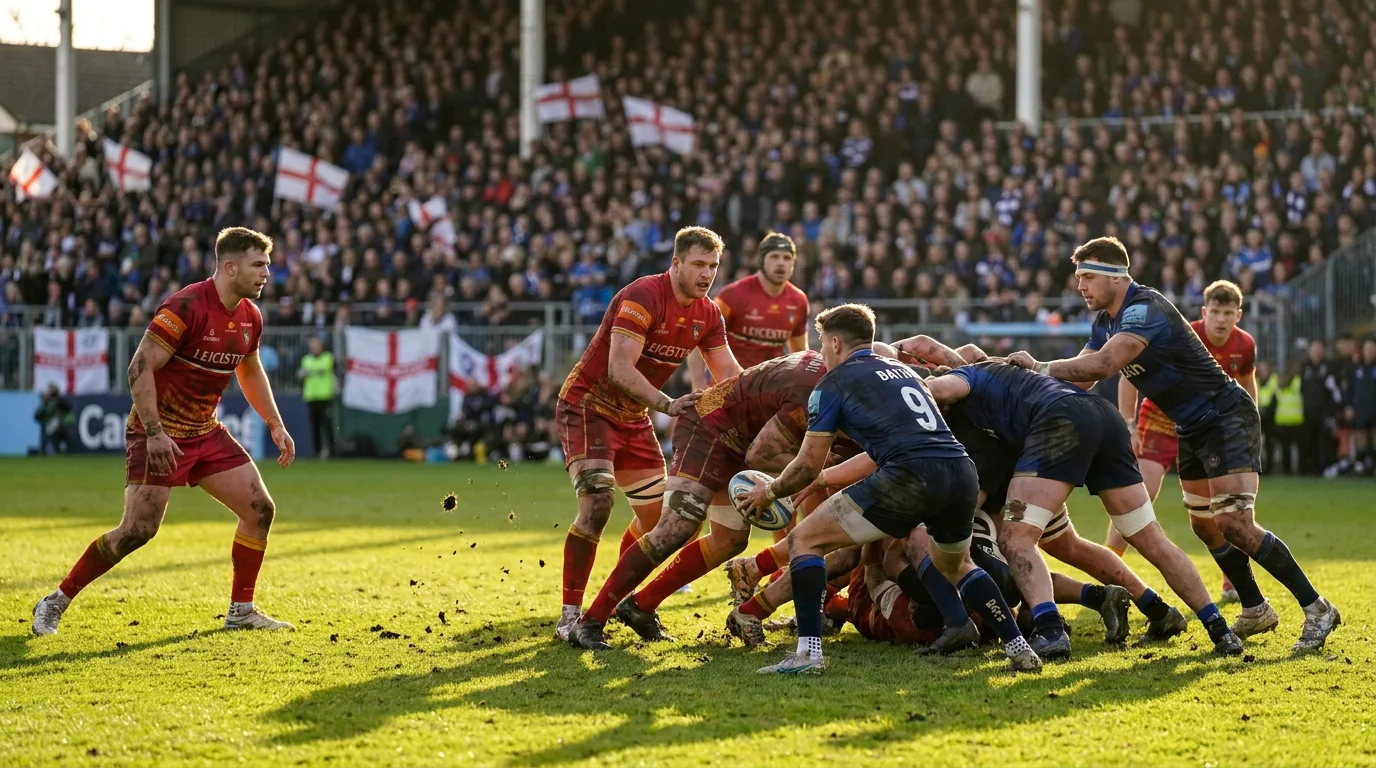
The 2025 Bath-Leicester final at Twickenham averaged 973,000 viewers across TNT Sports and ITV1, with the cumulative peak hitting 1.26 million. Those numbers were records. Simon Massie-Taylor, Premiership Rugby’s Chief Executive Officer, framed it as a moment for the competition: “Saturday’s Gallagher Premiership Rugby Final showcased the very best of Premiership Rugby. An enthralling contest between two iconic rugby clubs allied with sensational off-field entertainment, a host of brilliant community activations and an incredible in-stadium atmosphere made for an occasion that will live long in the memory.”
The Twickenham final is a neutral venue — the closest thing the Premiership has to international-rugby conditions. The home/away dynamic that drives most of the regular-season pricing is absent. Both finalists are playing on the same surface, in front of crowds that are usually split roughly evenly, and with the same logistical preparation. That removes about 4-5 percentage points of effective home advantage from the pricing equation.
What replaces home advantage in the final’s pricing? Three things. First, recent form and team-news availability, which tend to be the dominant factors because both sides have a 7-day window between semi-final and final. Second, the historical record at Twickenham — some sides genuinely play better under the closed-roof conditions, and the public undervalues that. Third, the squad depth question — finals are 80-minute matches where the bench impact in the final 20 minutes can swing a tight game.
The final markets I focus on are alternative handicap lines and try scorer markets. The headline handicap line on a Premiership final is usually priced within 1 percentage point of fair, and the totals line is similarly tight. The alternative lines — particularly the team total tries and the specific player markets — are softer because volume concentrates on the headlines.

Massie-Taylor’s framing earlier in the cycle — when he said: “I am delighted to see over 700,000 additional viewers and more than 21,000 more supporters buying tickets to watch the opening exchanges of the Gallagher Premiership. To see thousands more fans through the turnstiles and the TV audience growth accelerating is a huge achievement and testament to the hard work of our clubs, the Premiership Rugby team and our long-term broadcast partners TNT Sports” — describes the competition’s audience trajectory rather than the final specifically. But the audience growth narrative compounds into the final’s commercial weight, which compounds into the betting market depth, which compounds into pricing efficiency on the headline markets.
Top scorer markets and the special bets worth knowing about
The top points scorer of the Premiership season is a market that opens in August and runs to June. The leading candidate going into a season is usually the fly-half of the previous season’s top-three side — they get the most kicking opportunities, the most attacking phases, and the most tries assisted by sustained pressure. The same logic applies to top try scorer, with the leading candidate usually a winger on a top-four side.
These season-long markets are interesting because they reward consistent availability as much as ability. The fly-half who plays 20 of 22 regular-season fixtures will outscore the more talented fly-half who plays 15 of 22 due to international duty. International availability is the single biggest variable. The English internationals miss matches for Six Nations, autumn internationals, and (in World Cup years) the World Cup window. Backing a home-international fly-half at the start of a World Cup year is a structural mistake.
The top try scorer market has the opposite dynamic. The Premiership wingers who score most prolifically are often the ones not picked for England — they play the full season uninterrupted while their internationally selected peers miss six weeks. The 14/1 underdog winger on a top-four side, available for the full season, is a more interesting bet than the 7/2 favourite who’ll miss the Six Nations window.
Special markets specific to the final include winning margin bands, half-time/full-time double result, time of first try, and player-specific specials. These are the softest markets on the final’s board, because volume concentrates on the headline markets and the specials get less attention. The variance is high — these are markets where a model-based bettor can lose ten in a row before hitting one — but the price-to-fair gap is wider than on any other market in the final.
One specific market I check every Premiership weekend: the first try scorer market on the away side. Public money concentrates on home-side wingers, particularly in the marquee Saturday fixtures. The away winger at 8/1 or 9/1 first try scorer is often genuinely undervalued. The math is simple: if the away side scores the first try, they’re statistically likely to be in possession in the home 22, and the away wingers are the most likely individual scorers from that position. The public underweights this.

For the deeper work on reading form for individual selections — which is the prerequisite for getting these markets right — the breakdown on reading a Premiership form guide covers the metrics that actually predict next-weekend performance versus the metrics that look impressive but don’t.
